Nodes
Nodes Screen supports administrators for easy and quick access of status and details of all managed nodes because it displays the list of all added nodes via Add Node and Add vCenter method.
Then, go to the Nodes screen. The nodes table will display all the nodes, such as:
-
Host (Server)
-
Virtual Machine
-
Application
-
Network Devices
-
Others
Navigation: Infrastructure → Node Configuration → Nodes
You will open Nodes screen table where you can see below options:
| Options | Description |
| Download | To download the node details in the format of excel |
| Manage | To assign the Threshold, KPI and Notification Template |
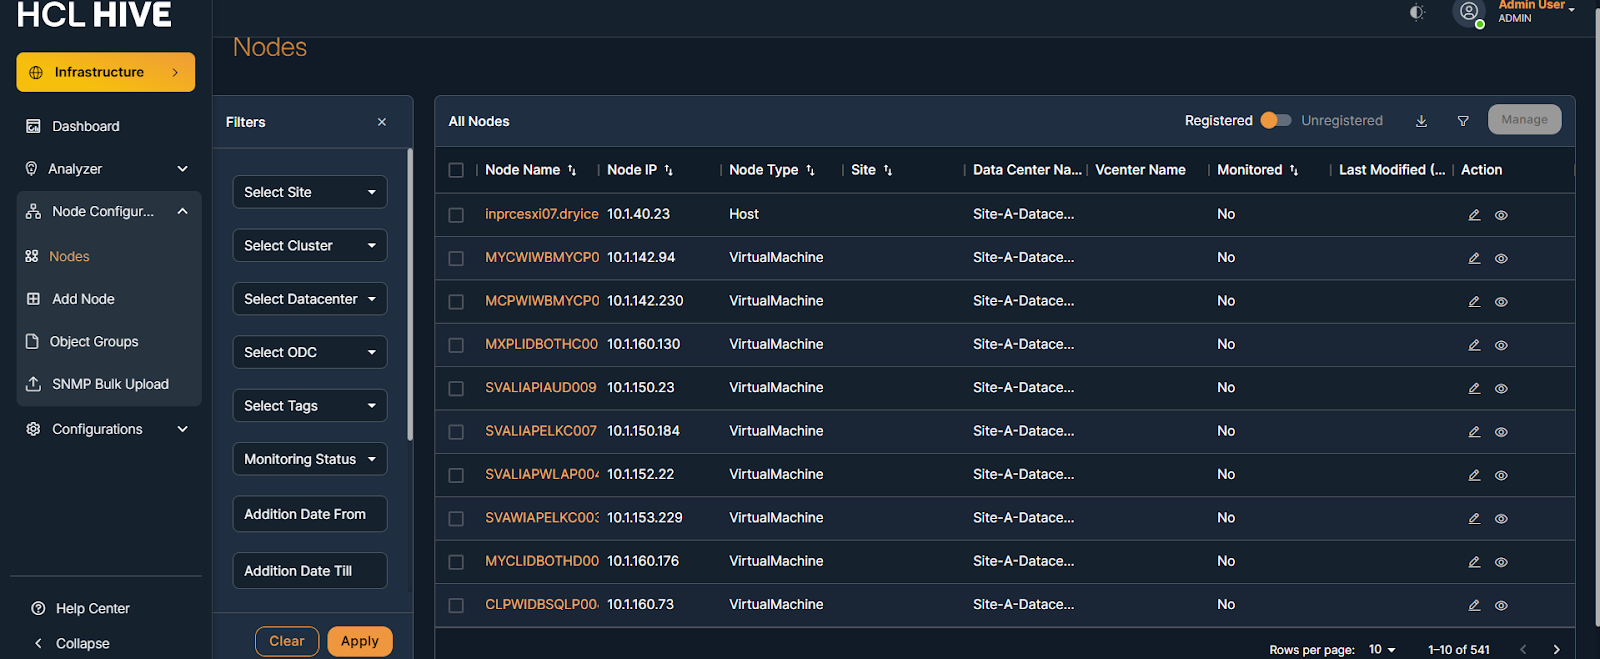
| Filter |
To Advanced filter the nodes list based on ODC, site location, date, sources, monitoring status etc Please refer the image - |
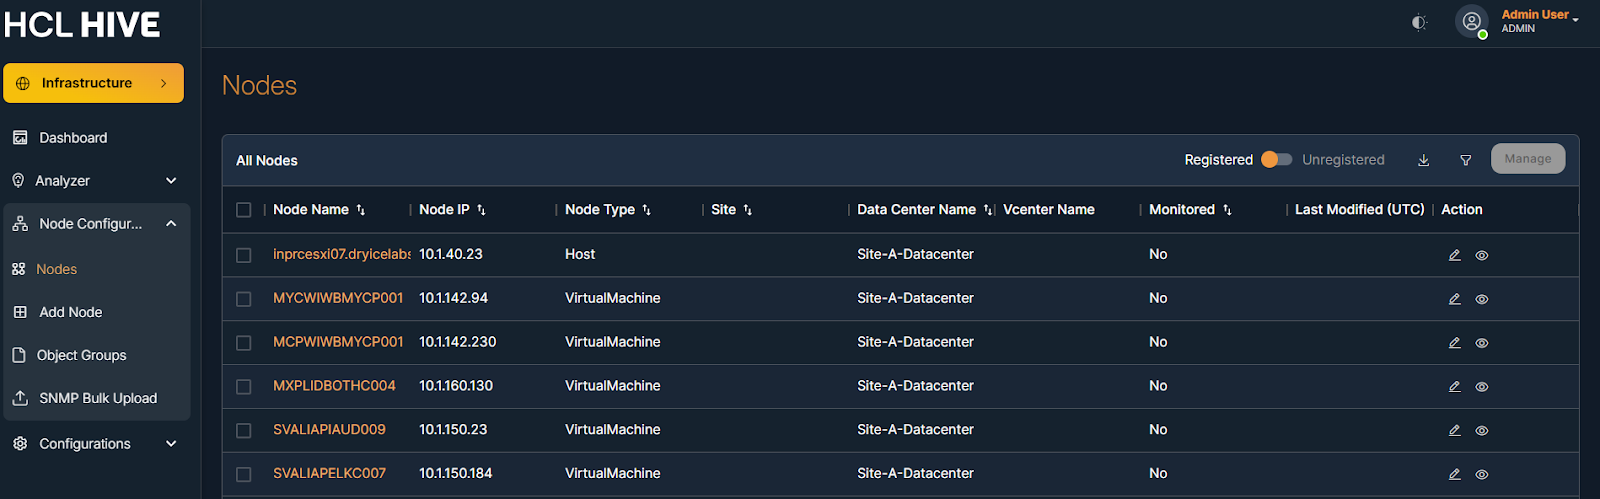
The table also shows node-related details like:
-
Server IP
-
Data Center Name
-
Node Type
-
Monitored Status
-
Last Modified Date, etc.
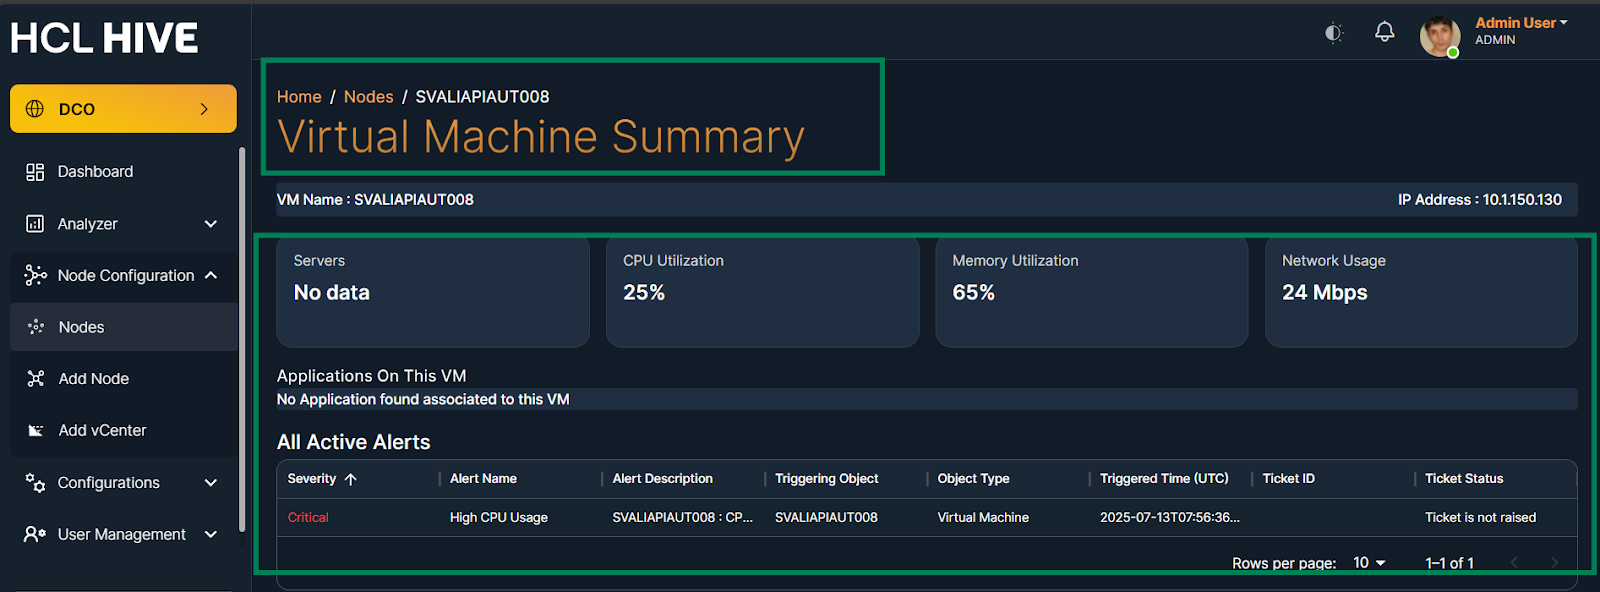
On click the node name in the nodes table to be redirected to the Node Summary screen.
Node summary helps monitor node health and performance trends over time.
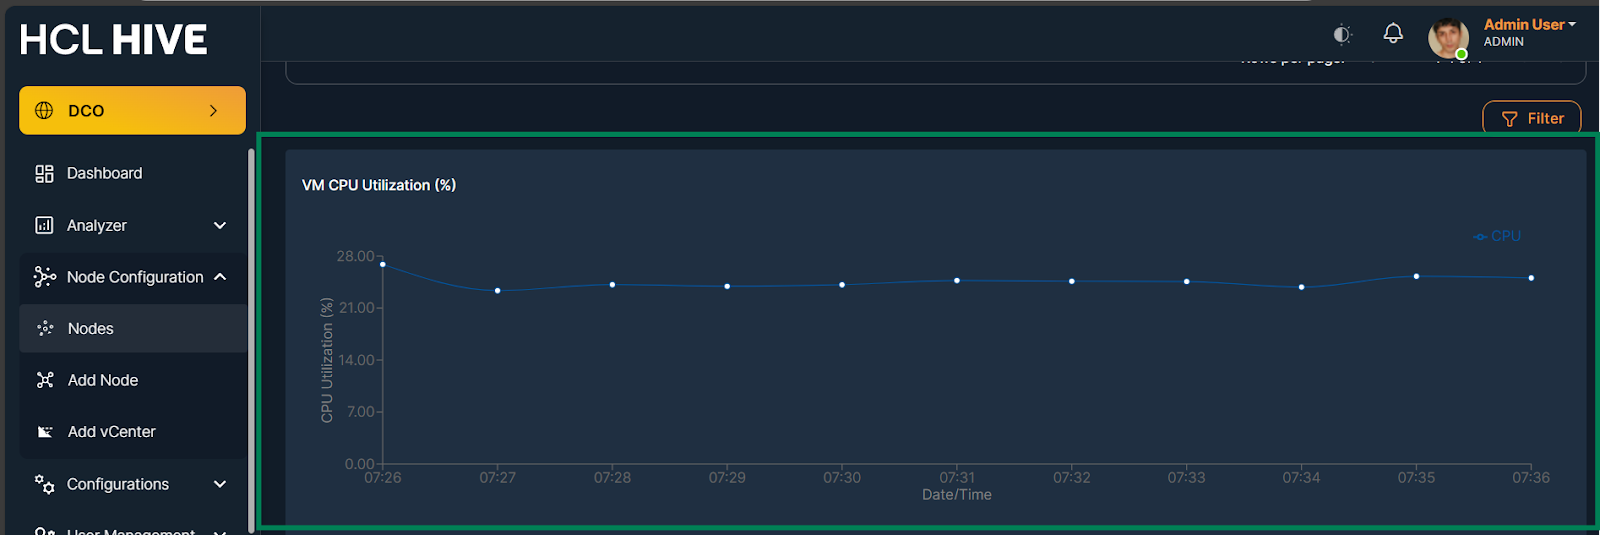
The Node Summary screen displays node details in an Overview Card and shows additional information in graphs, such as:
-
CPU Utilization
-
Memory Utilization
-
Network Usage
-
Storage Utilization
-
Transmitted and Received Data
-
Latency and Other Data