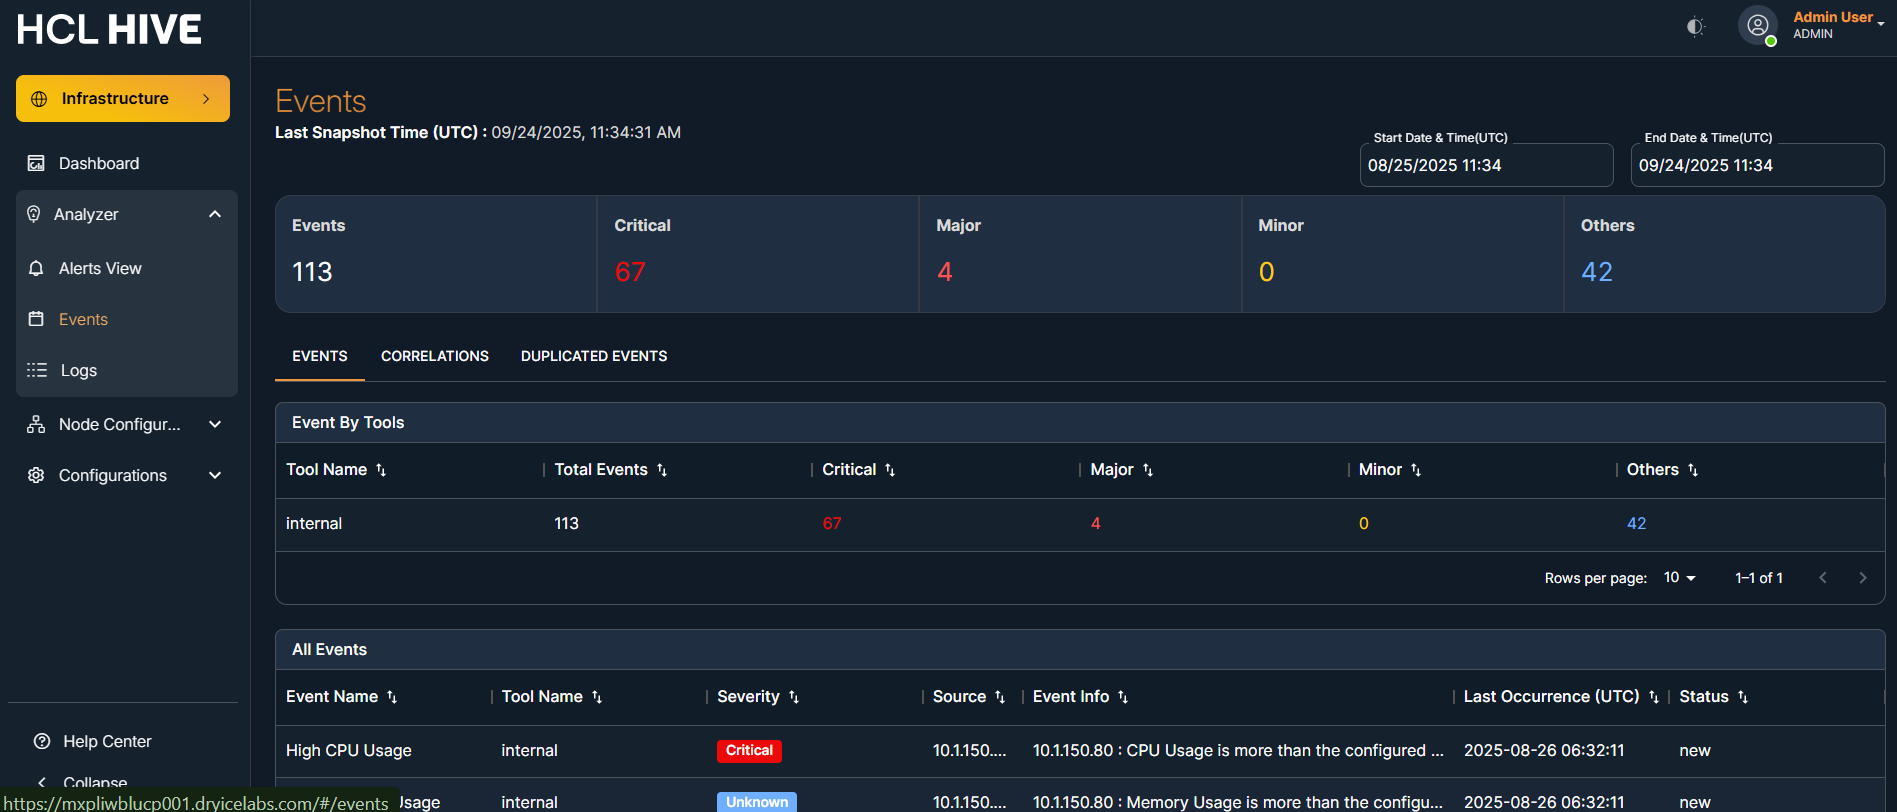
This section provides an overview of all events collected from various tools (like
OTEL, SNMP) over a selected time range.Figure 1. Figure - Events Overview
Key Elements:
Field
Description
Total Events
Displays the total number of events captured from all sources during
the selected time frame.
Critical / Major / Minor / Others
Categorized event counts by severity. In the screenshot, all 1730 are
under "Others".
Tool Name
Source tool that generated the event (e.g., SNMP).
Events by Tool Table
Shows the tool name, total events, and how many of them are Critical,
Major, Minor, or Others.
Correlations Tab
Lists any correlated events (grouped based on rule logic). In the
current data, no correlations are available.
Duplicated Events Tab
Displays events considered duplicates (based on rules or identical
parameters). No duplicated events are shown in the snapshot.
Event Listing
Shows event details including event name, tool, severity, source,
event info, last occurrence time, and status.
Filters and Controls:
Date/Time Picker (UTC): Filters events between custom Start and
End time.
Tabs: Events, Correlations, Duplicated Events for toggling
between views.
Sorting: Columns are sortable (e.g., Total Events).