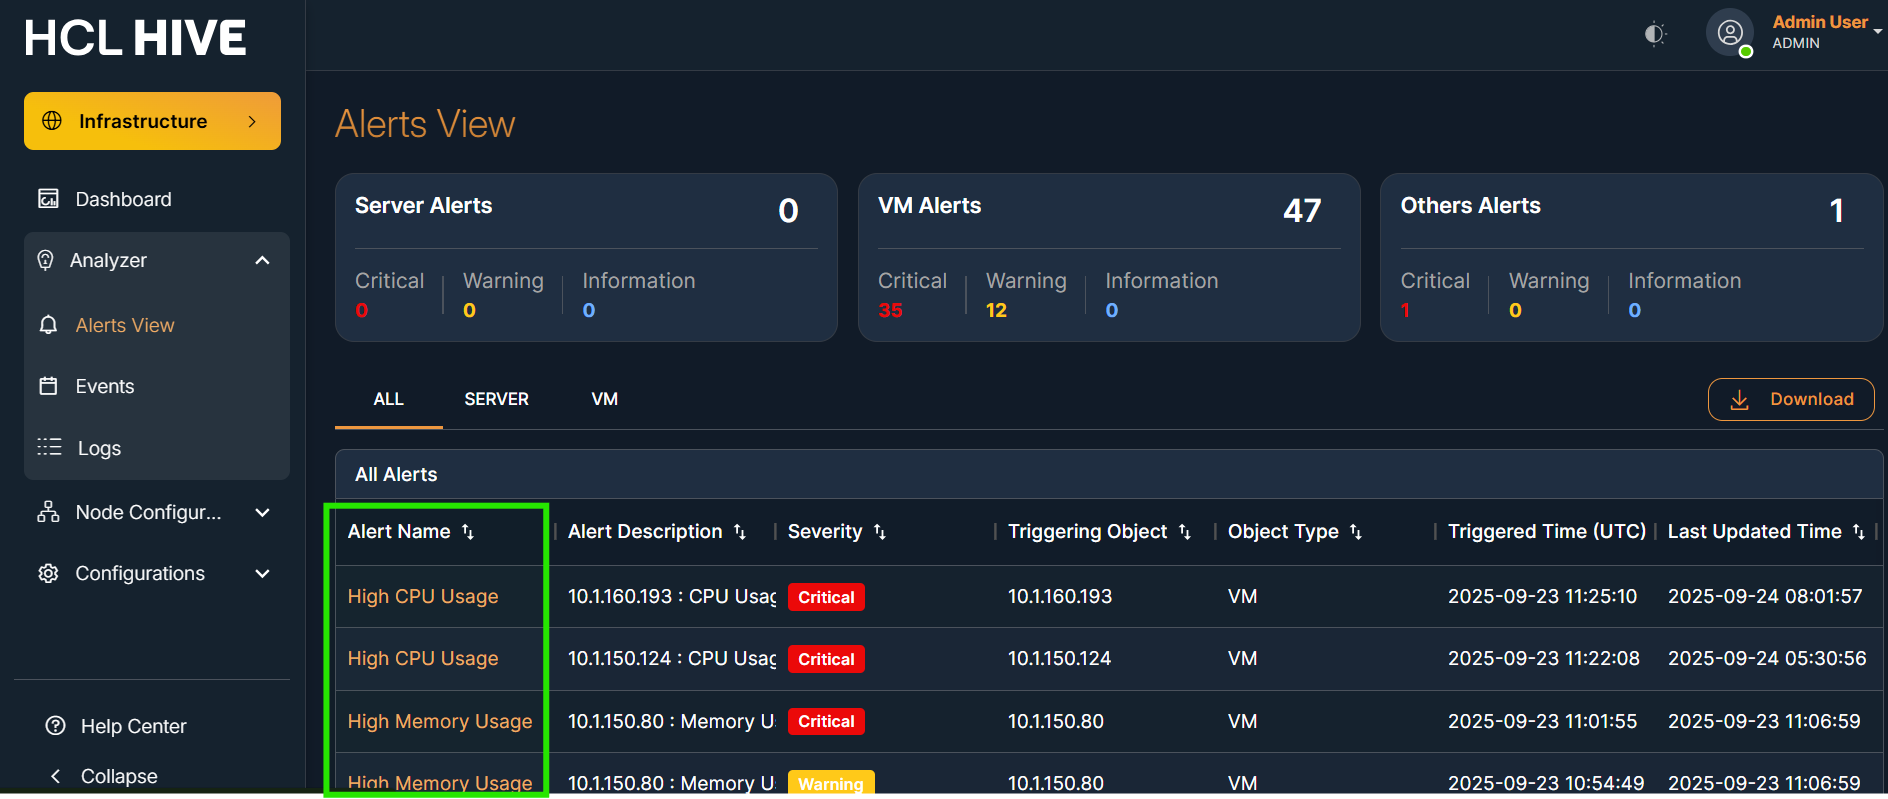
Alerts View
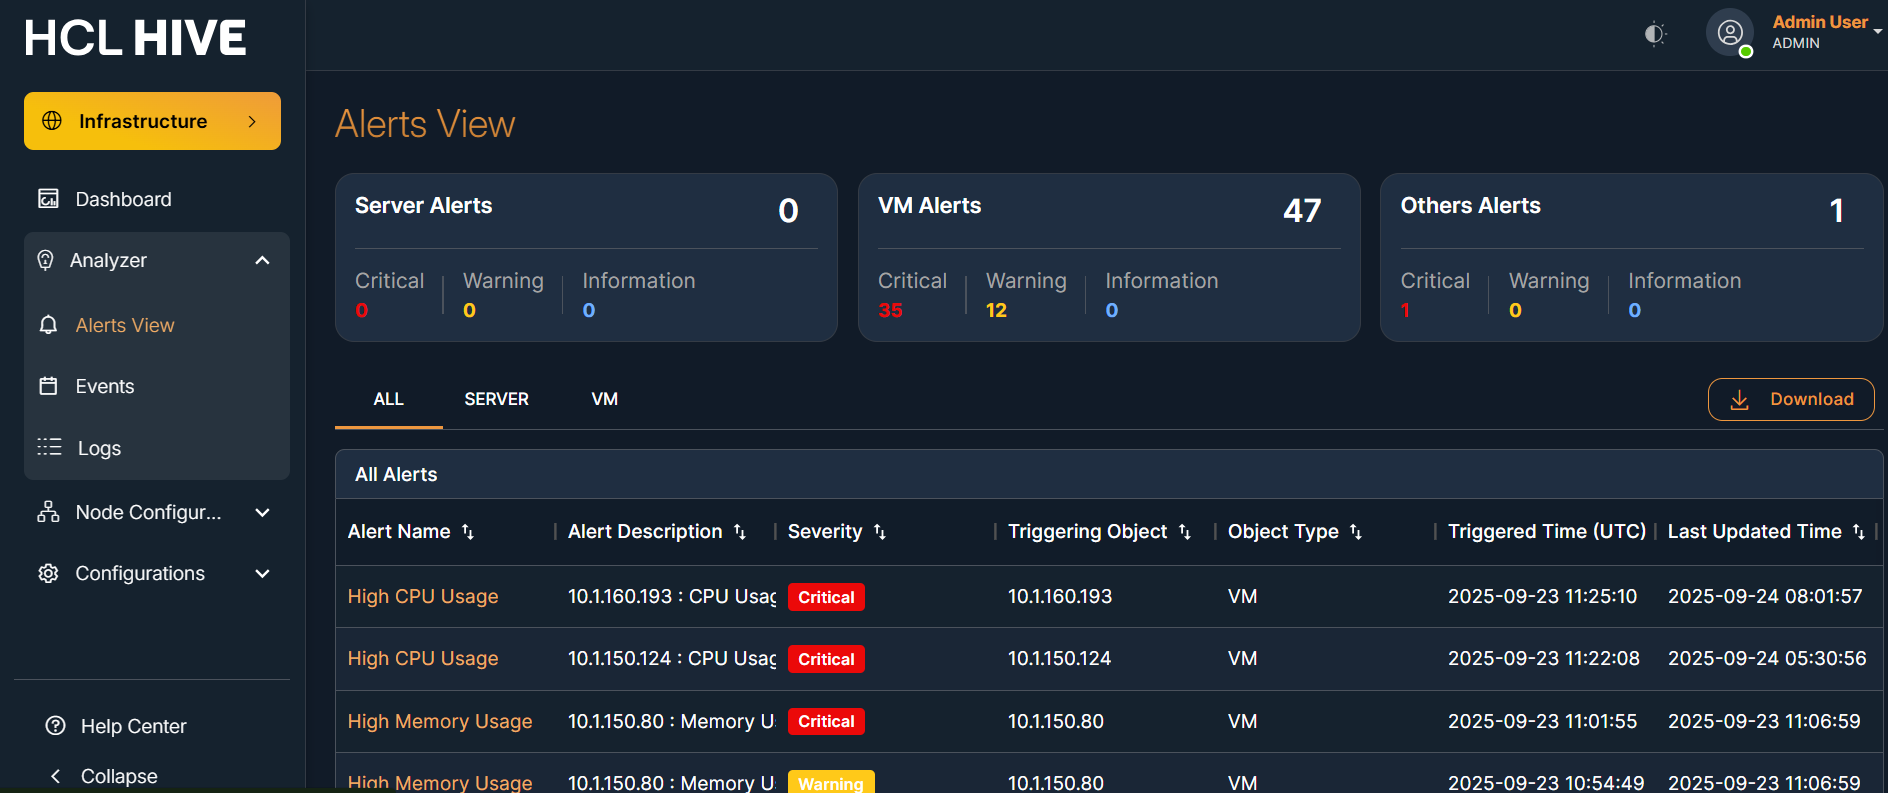
This screen provides a real-time overview of all active and historical alerts.
This breakdown allows users to focus on specific areas that may require attention.
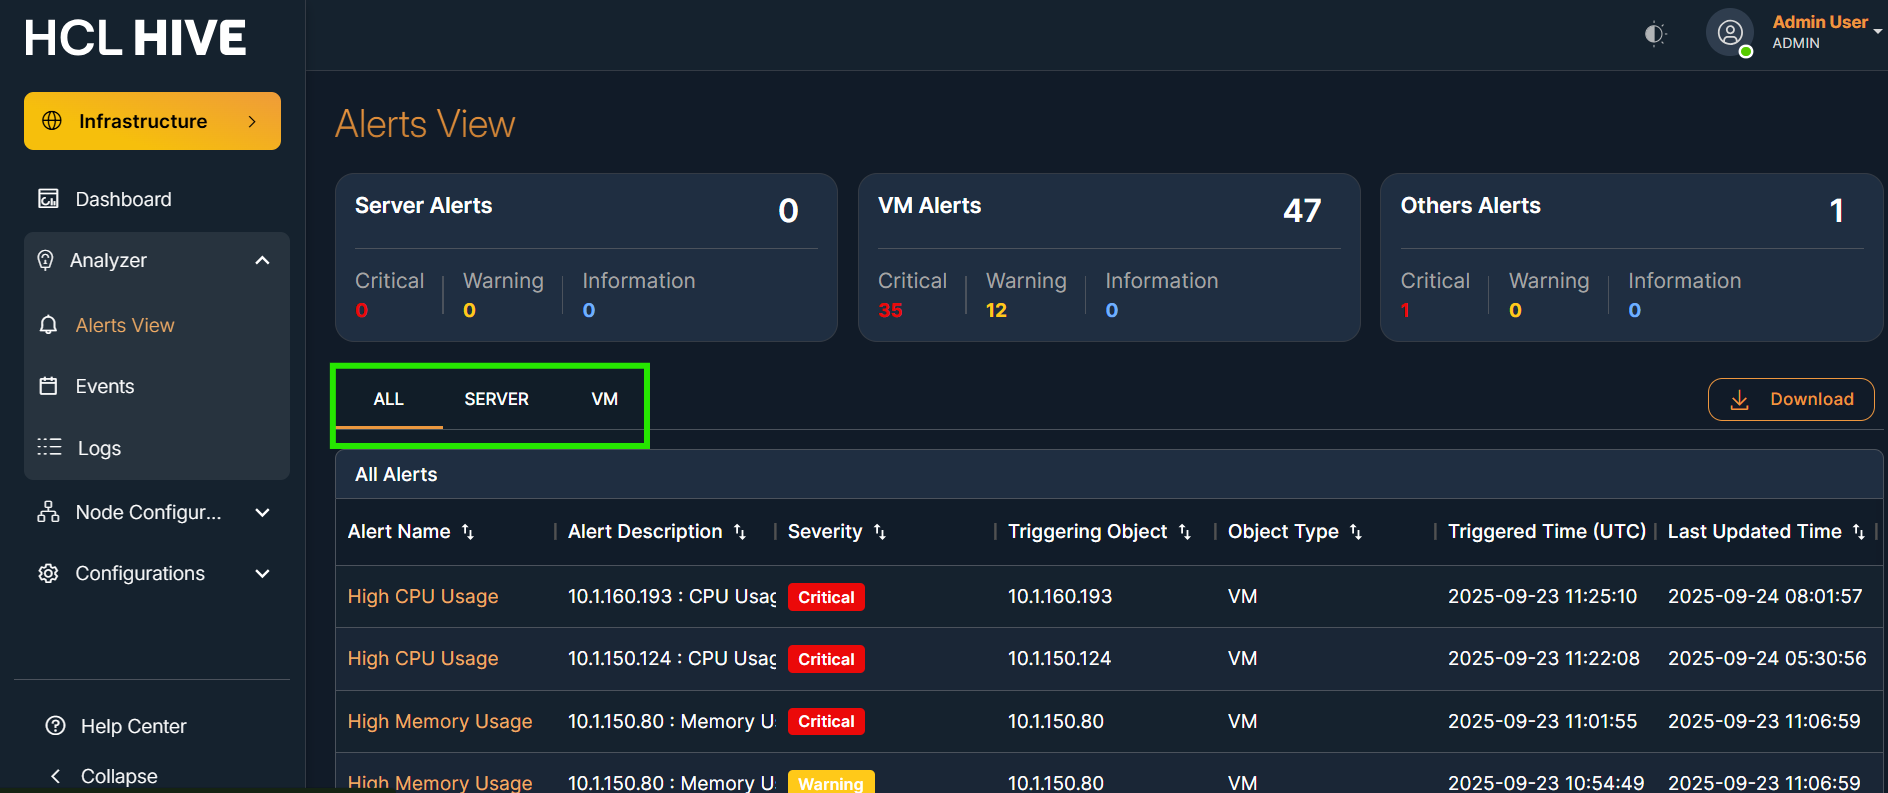
In the select tab, users will see alert details presented in a table format.
The table displays only those alerts for which the user has assigned templates in the nodes table.
The table provides detailed information for each alert, making it easier to investigate and take action.
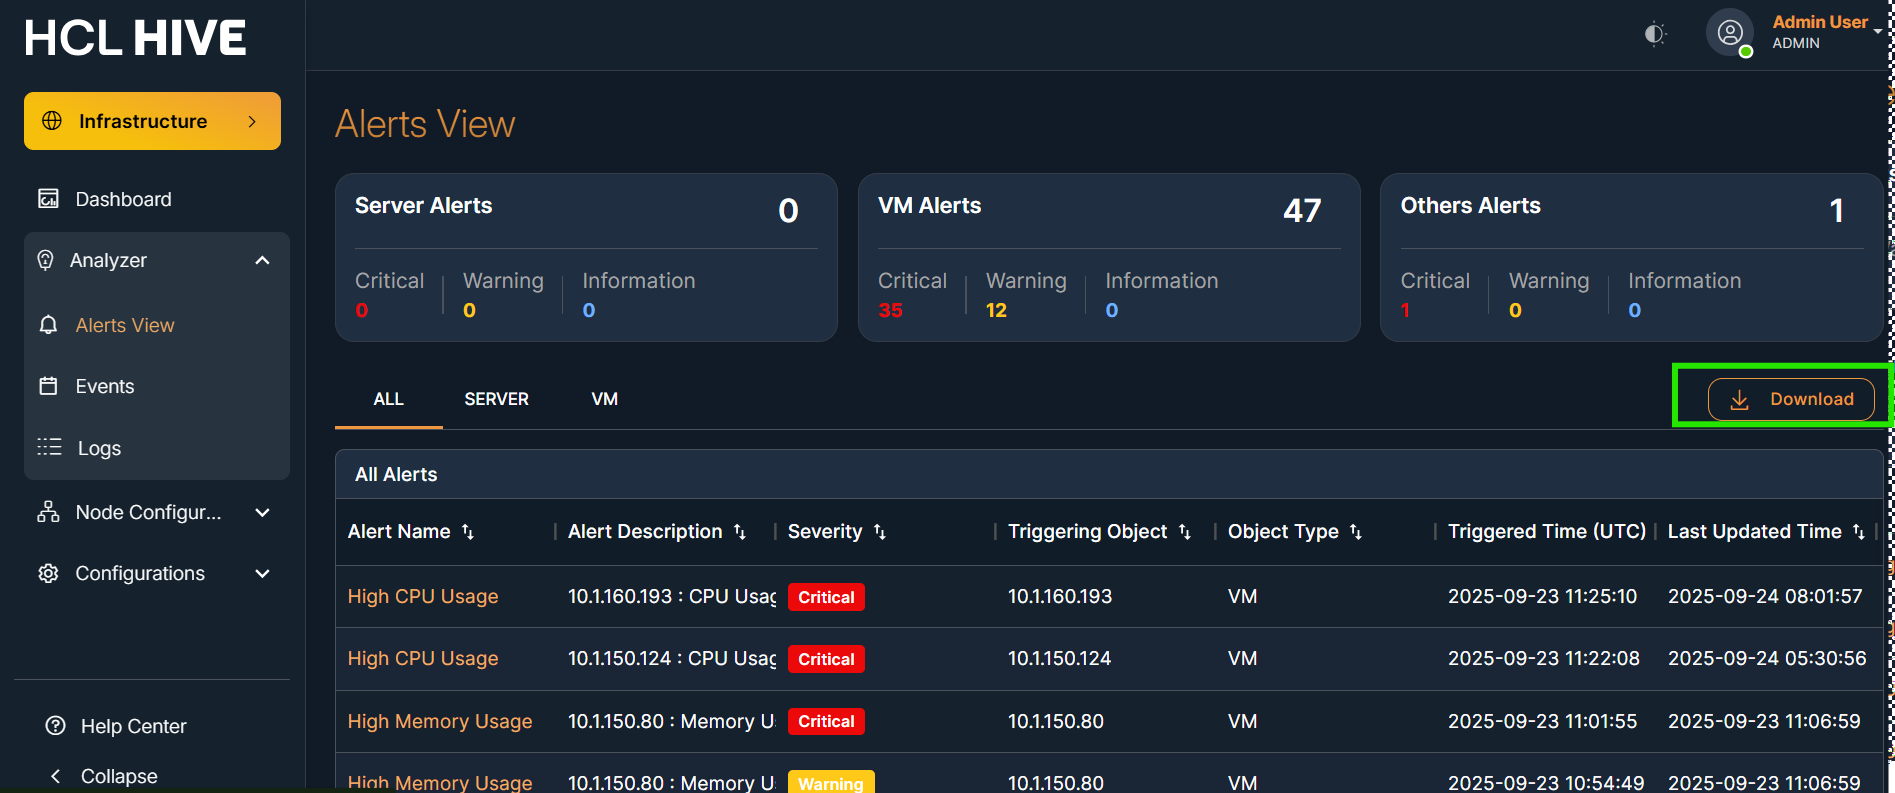
Exporting data helps with documentation, sharing, and audit purposes.
Clicking on an alert name allows the user to view additional details for that particular alert.
This detailed view provides more context and information to help resolve the issue efficiently.
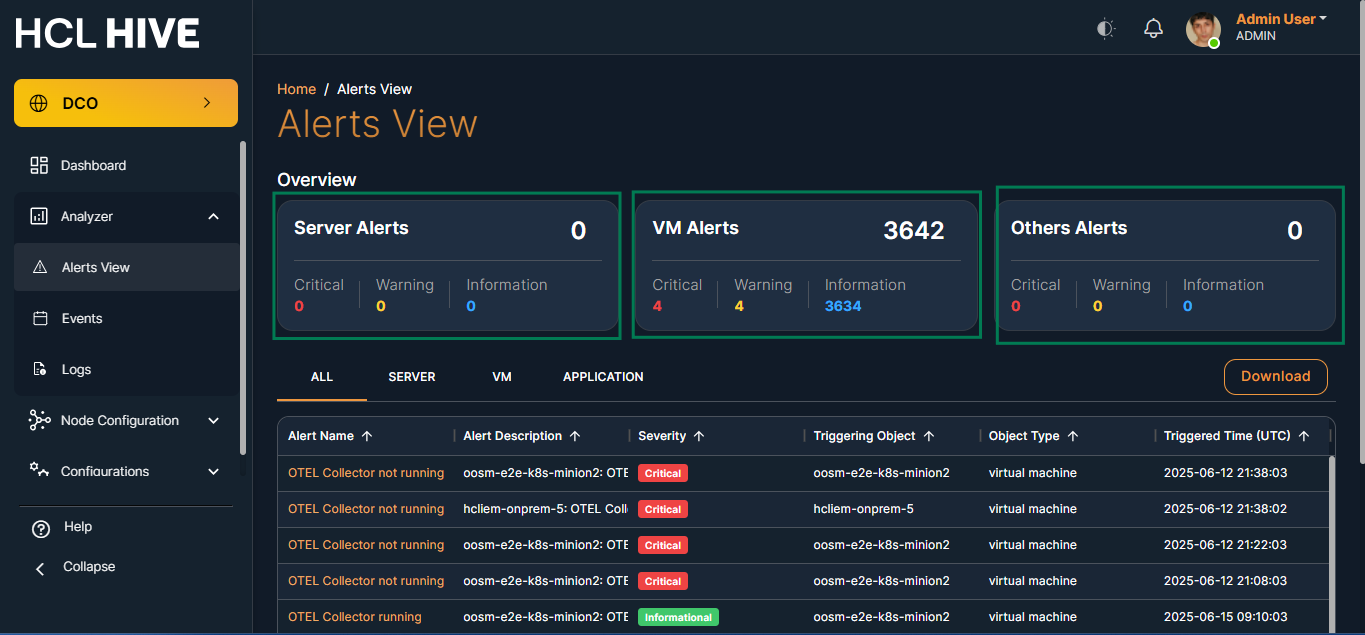
The Alerts View screen in the Hive platform displays real-time alerts that are generated based on threshold templates configured in the backend. These alerts are primarily triggered by monitoring tools like SNMP , OTEL Collector and reflect the health status of monitored virtual machines, servers, or applications.
Purpose:
This page provides visibility into system alerts by showing:
- The severity of each alert (Critical, Warning, Informational).
- The type of object that triggered the alert (e.g., VM).
- The source tool that generated the alert (e.g., SNMP,OTEL).
All alerts seen on this screen are based on Threshold Templates defined under Threshold Configuration in the backend.
| Metric | Description |
| Server Alerts | Alerts generated from server-based monitoring rules. |
| VM Alerts | Alerts triggered by threshold conditions applied to virtual machines (VMs). |
| Others Alerts | Reserved for alerts from non-VM/server sources. |
Each alert category shows counts for:
- Critical Alerts
- Warning Alerts
- Informational Alerts
| Column Name | Description |
| Alert Name | Title of the alert triggered (e.g., "SNMP/OTEL Collector running"). |
| Alert Description | Additional detail regarding the alert and its source. |
| Severity | The type of alert: Critical, Warning, or Informational. |
| Triggering Object | The node or VM that triggered the alert condition. |
| Object Type | Type of source such as "virtual machine", "server", etc. |
| Triggered Time (UTC) | The exact UTC time the alert was generated. |
| Tab | Description |
| All | Displays all alerts together. |
| Server | Filters and shows only alerts from server components. |
| VM | Displays alerts triggered by virtual machine metrics. |