Dynamic Dashboard
It is an interactive and adaptable data visualization feature that automatically updates and changes based on user input or real-time data. It allows users to:
- Drill down,Drill through or slice data by choosing different options (like dates, regions, products).
- Show or hide specific data elements or columns based on preferences or roles.
- View data that updates in real-time or refreshes on demand.
- Create a Dashboard : The user needs to click on the new button present on the Homepage and
then select “Dashboard”. Raw empty template for new dashboard creation opens on clicking the
dashboard button under New icon.
Figure 1. Figure - Create Dashboard 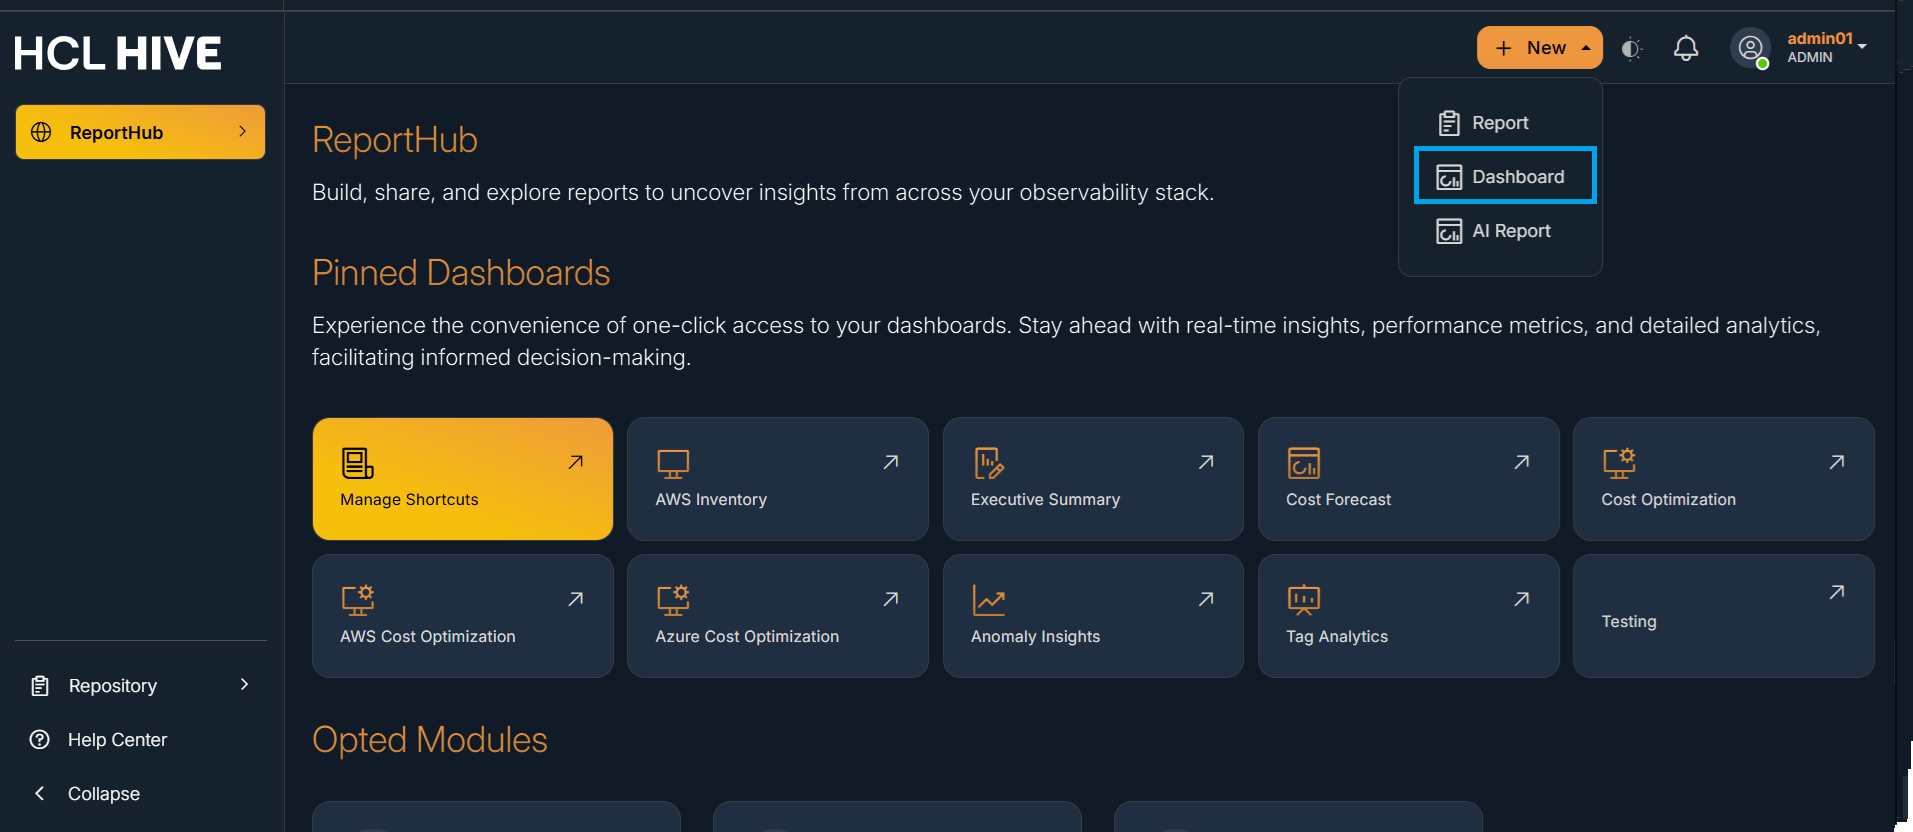
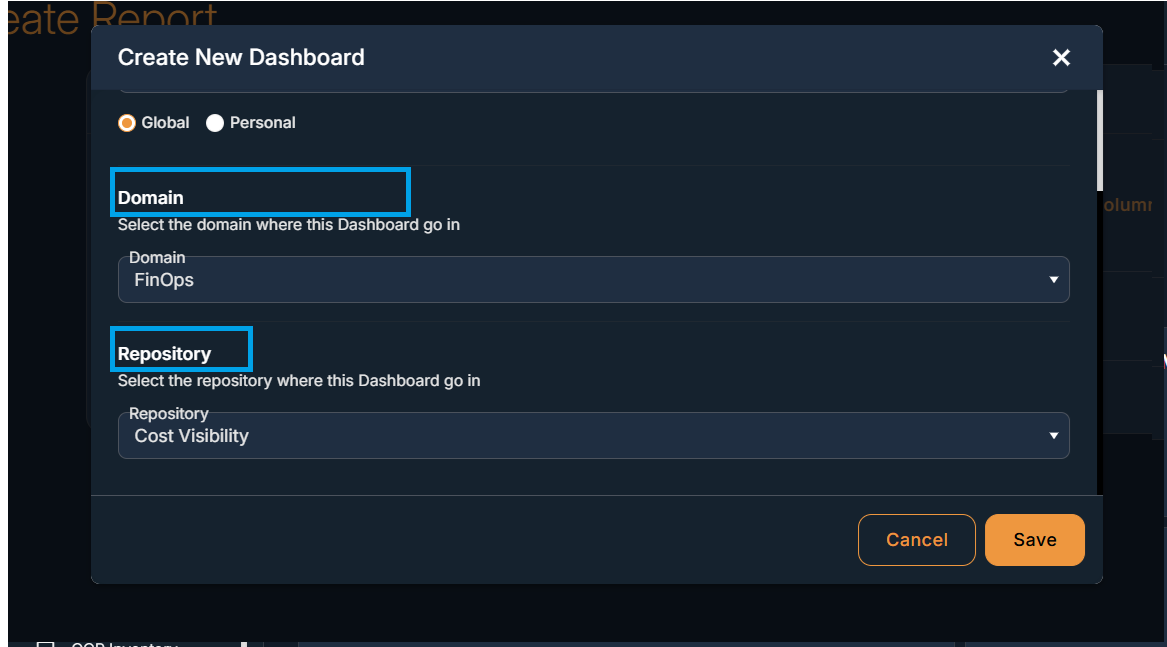
- The Dashboard template has one field "Dashboard name" and two dropdowns "Domain" and "Repository" to create a new dashboard . Users need to select these fields to create a dashboard.
- Further user gets 2 options at the bottom of the template i.e. “Save” and “Cancel” ,
either to save the newly created Dashboard or to close the template without saving it.
Figure 2. Figure - Create Dashboard 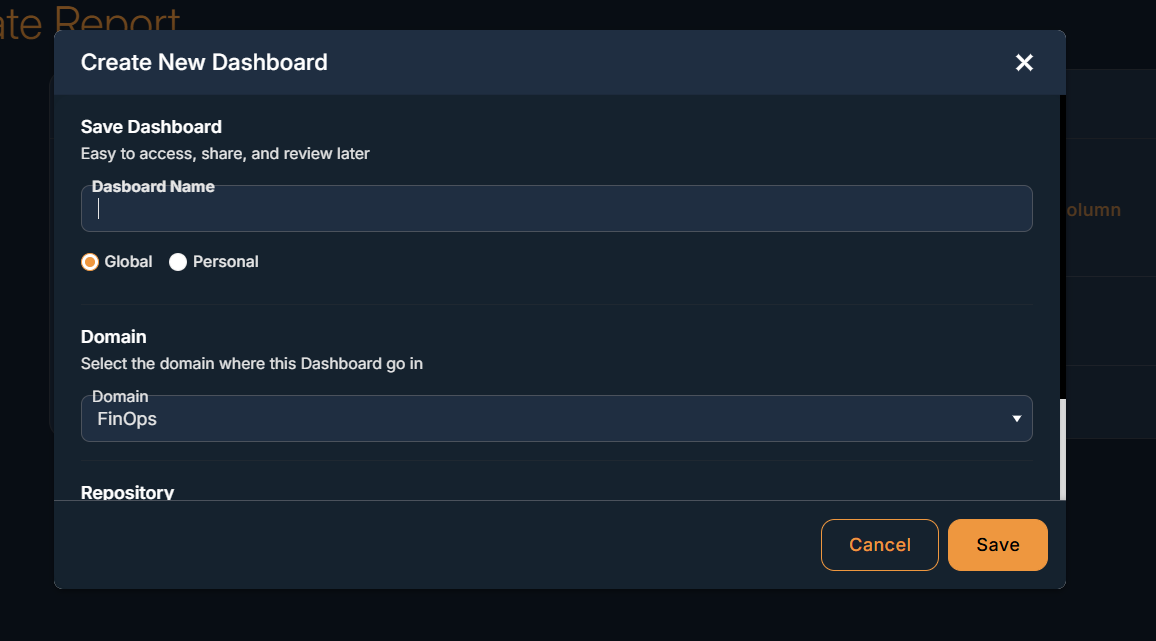
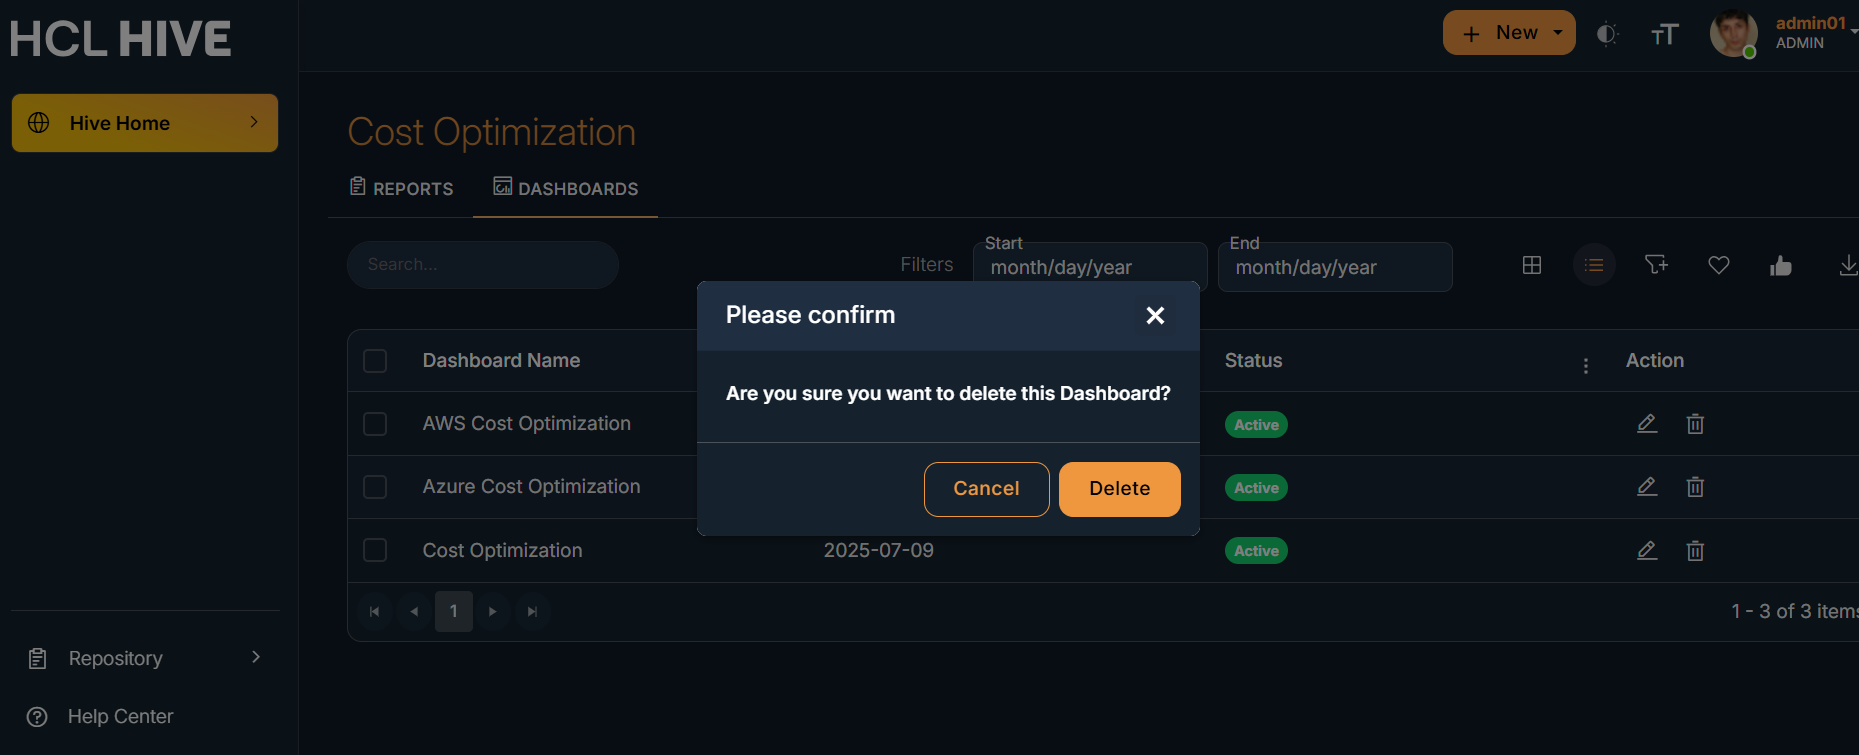
- Delete a Dashboard: The user needs to click on the delete icon present on the right
side , popup to either delete or cancel the dashboard appears. Click on the delete button to
delete the particular dashboard.
Figure 3. Figure - Delete Dashboard 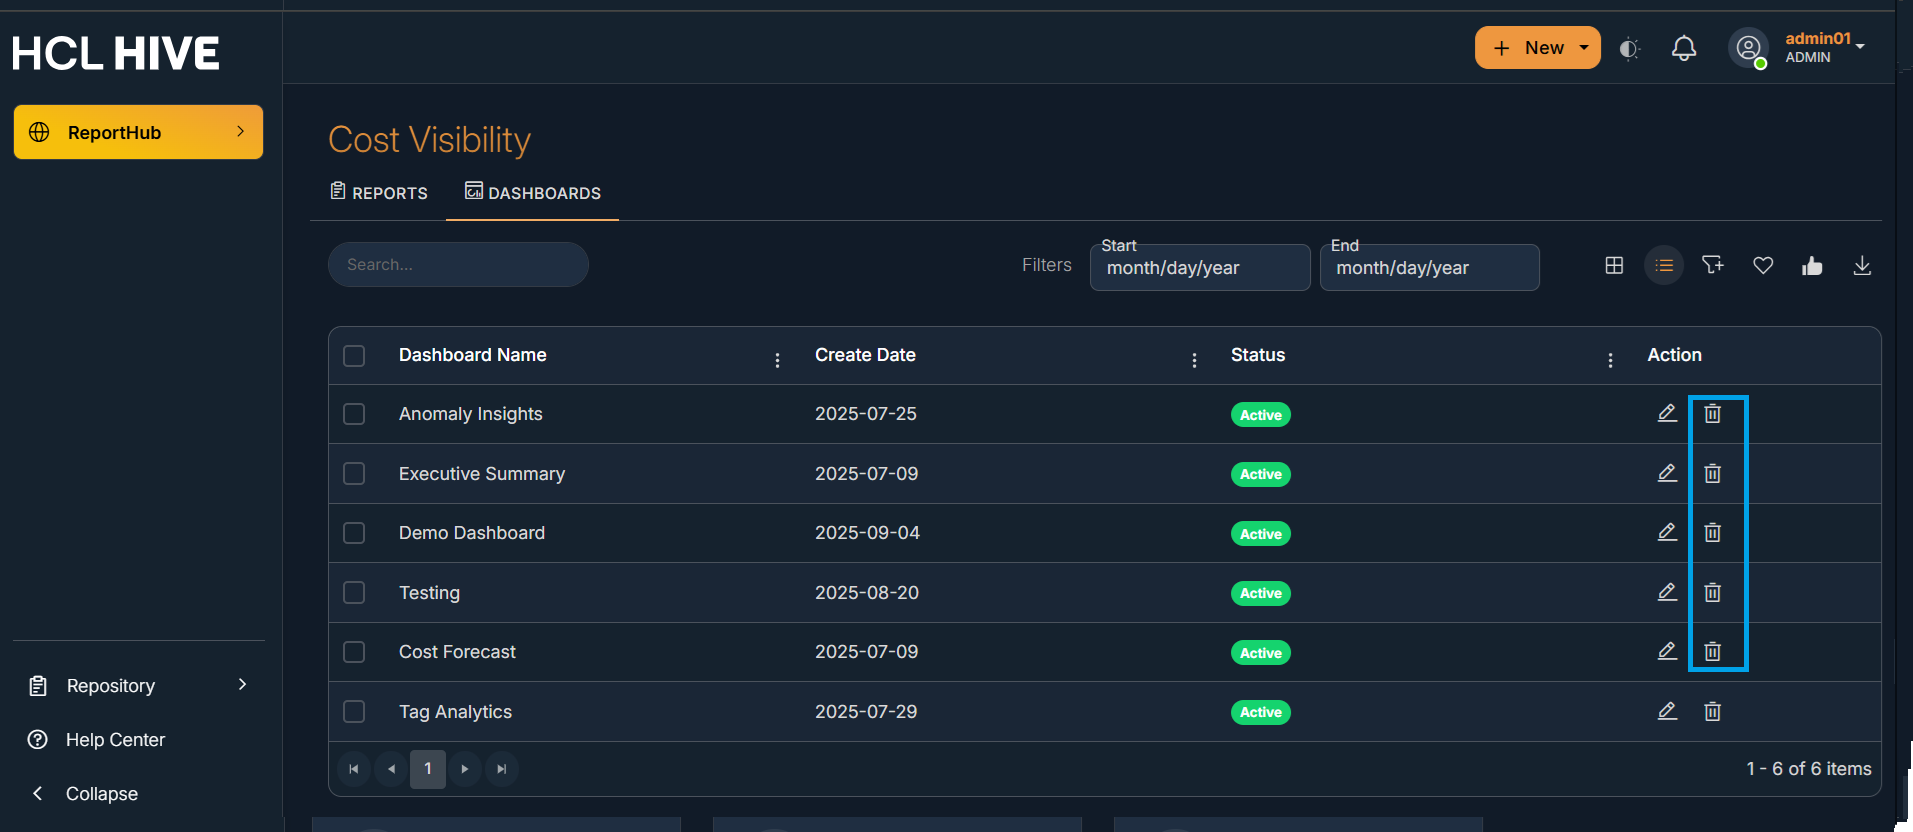
- Homepage with quick access to Dashboard and Domains: Users have direct access to
Dashboards as “Quick Links” and to Domains as “Opted Modules” on the Homepage.
Figure 4. Figure - Homepage with quick access to Dashboard and Domains 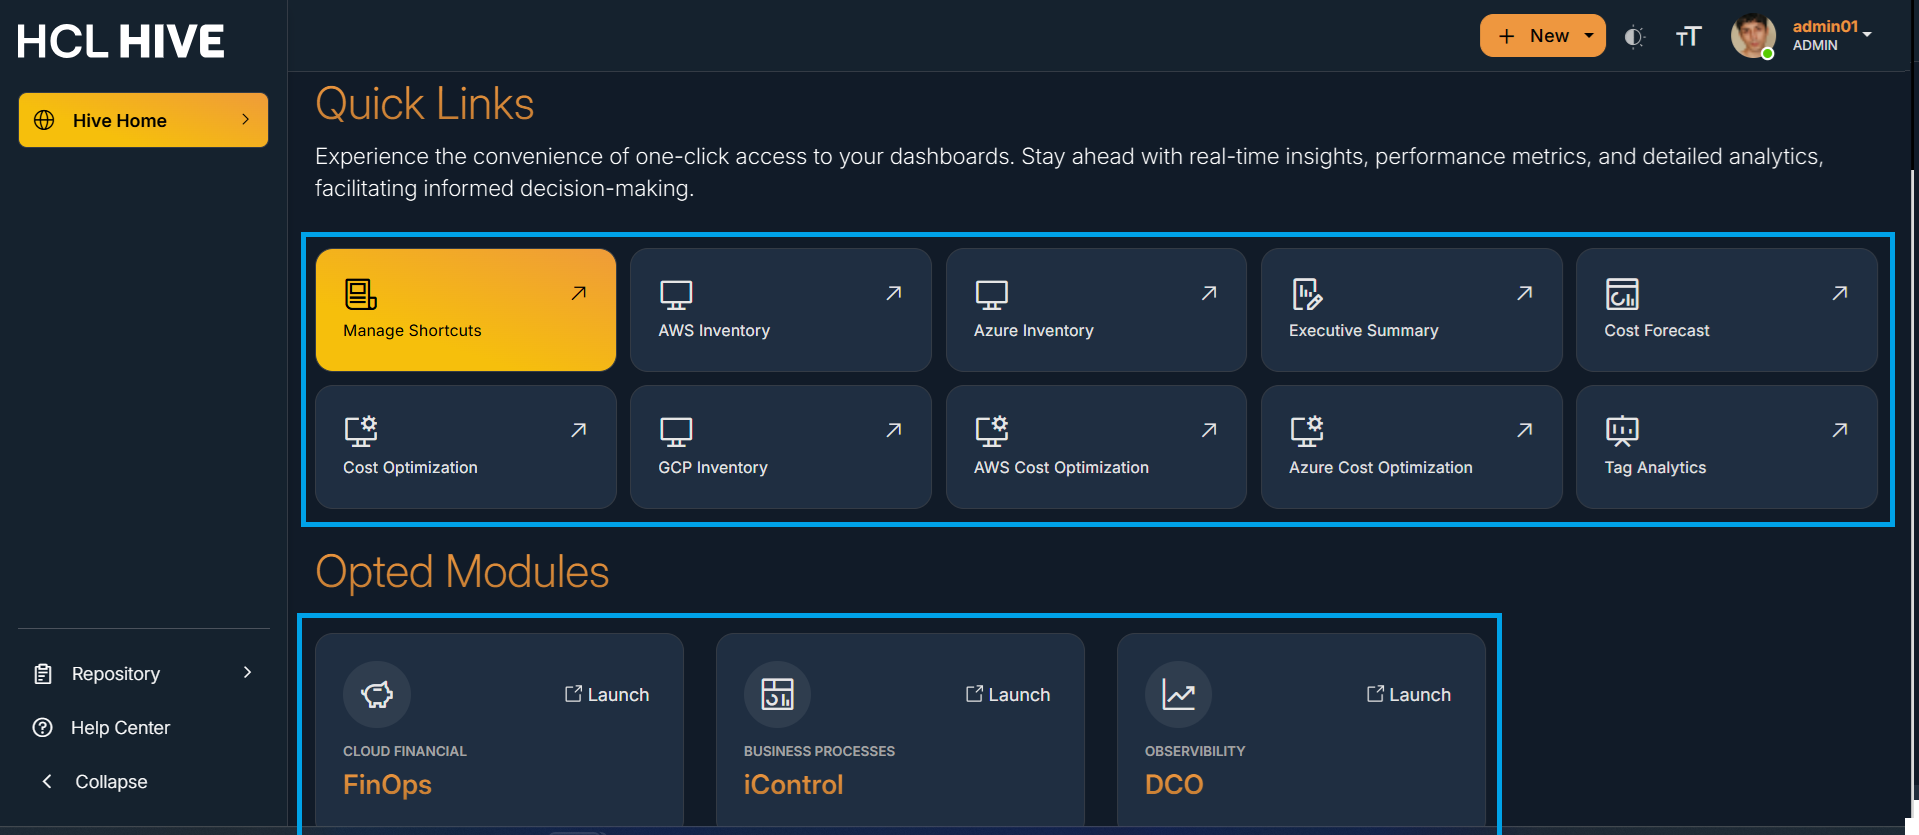
- Rearrangement of reports in the dashboard : Users need to navigate to any of the available Dashboards using the left guide menu on the home page and then click on the “Edit” icon to change the placements of reports on that particular dashboard.
- All the available reports on the dashboard can be easily rearranged by dragging and dropping the report to the desired location.
- Below picture shows the rearranged reports.
Figure 5. Figure - Edit Icon to rearrange the reports 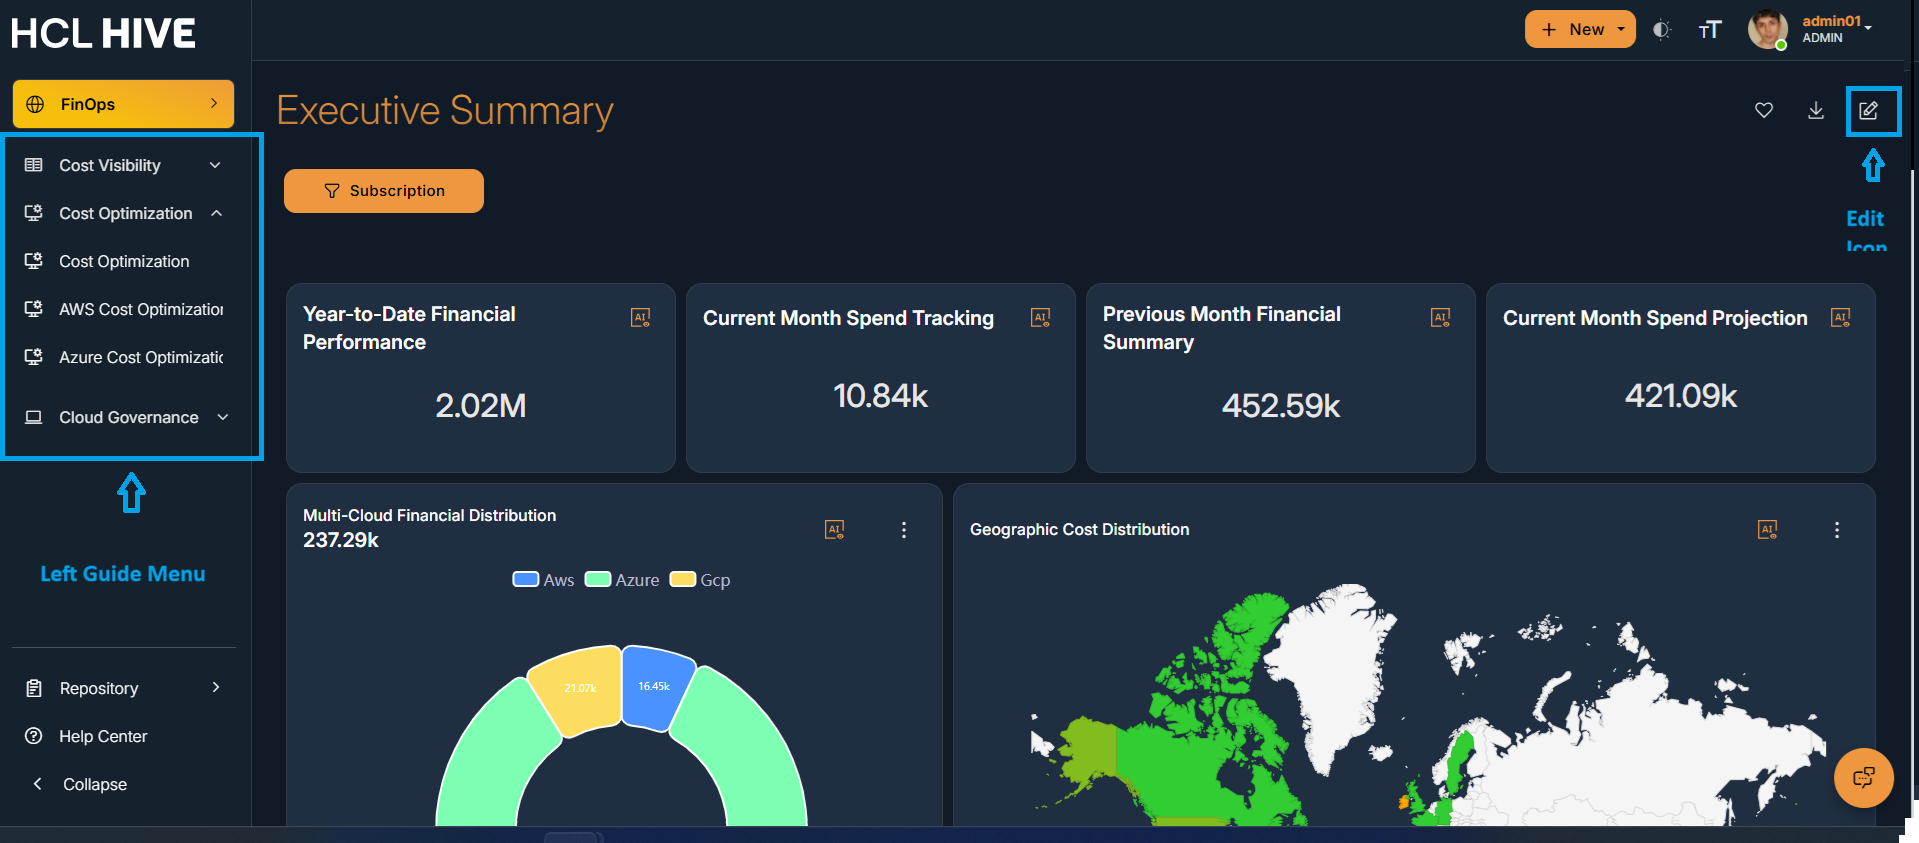
Figure 6. Figure - Rearranged Reports 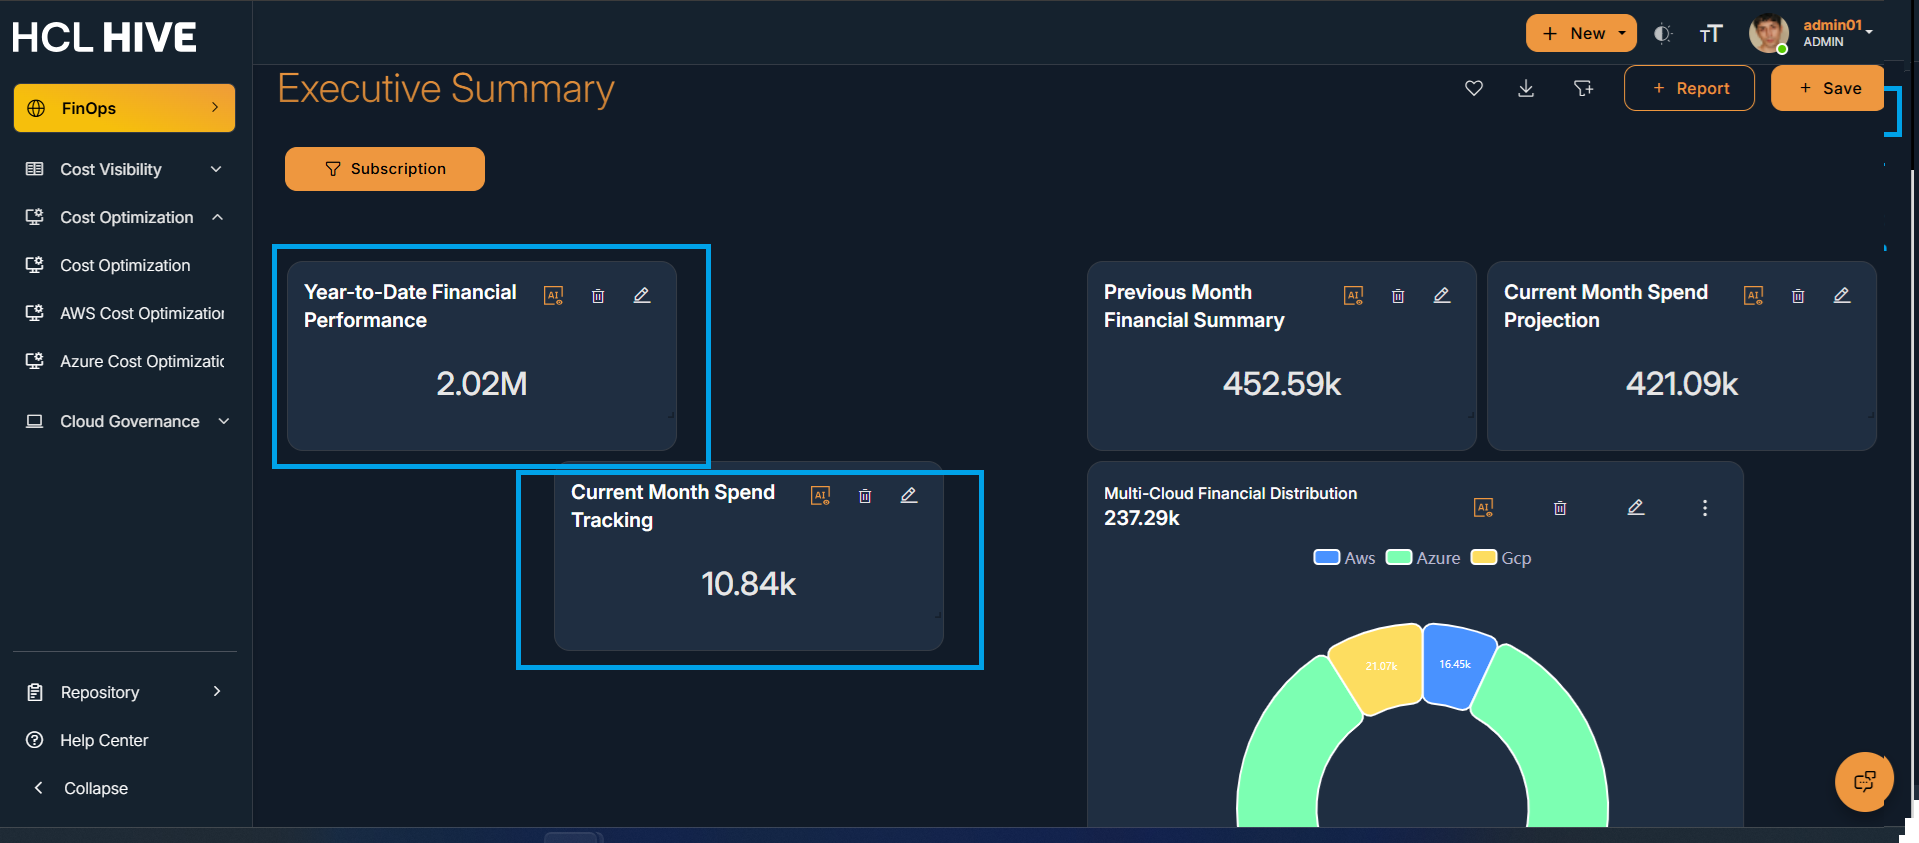
- Download dashboard (XLS, PDF, CSV, JPEG) : This feature helps the user to export the report i.e. customized or filtered snapshot of the data shown on the dashboard to your computer or cloud storage.
- For this user needs to click on the three dot menu present on the top right corner of the report and then click on the format in which the report needs to be downloaded.
- All the available formats like Excel , CSV , PDF , Image are listed when the user clicks
on three dot menu icons.
Figure 7. Figure - Download reports 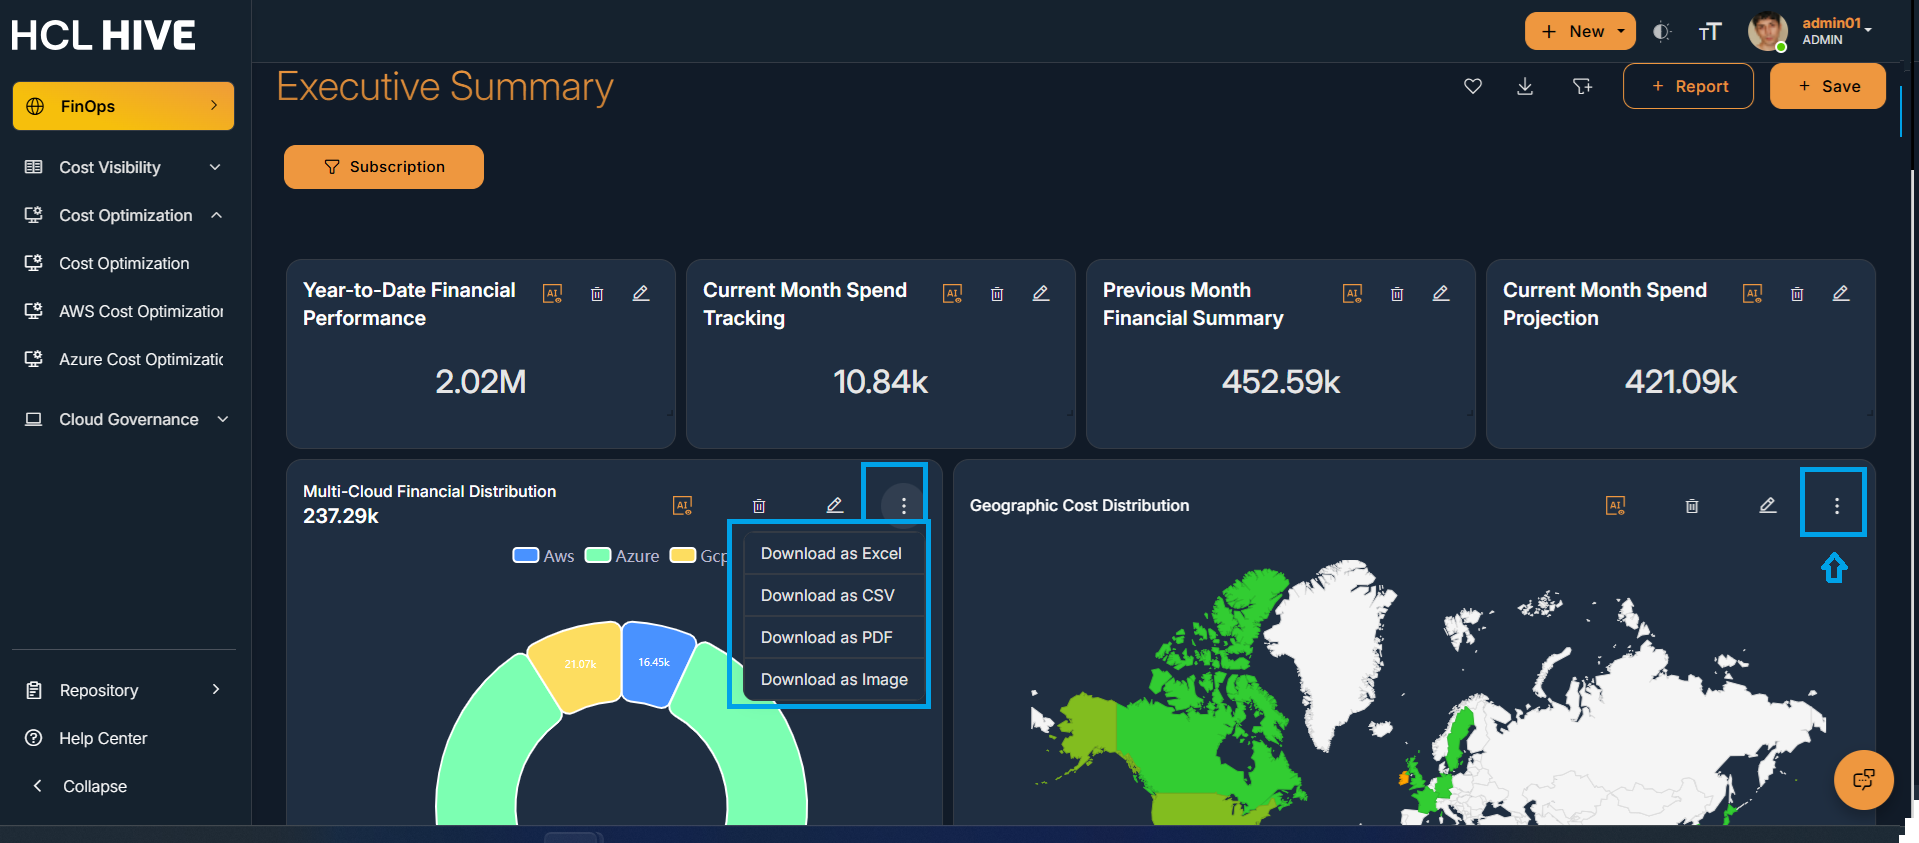
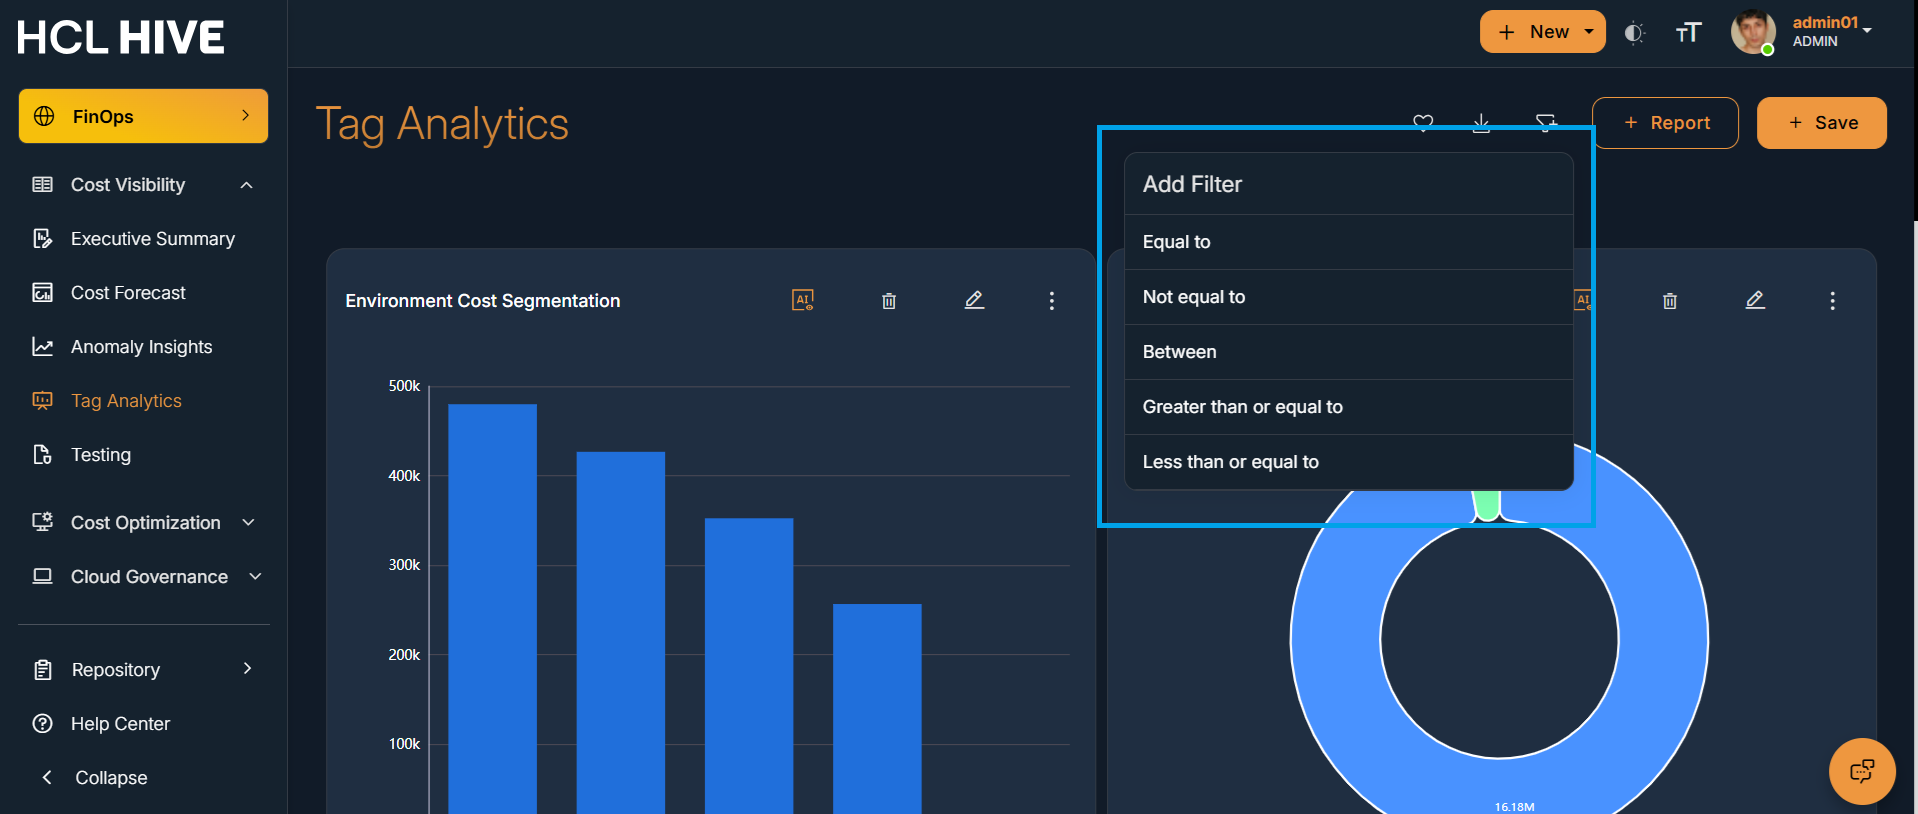
- Global Filter and Time Filter : A filter that applies to all or multiple reports on a dashboard at once, rather than just one specific visual is the global filter. It allows users to interact with a dashboard by selecting criteria that update all relevant reports at once.
- Hive provides users 3 categories under global filter :
- Time Filter : To view data for a specific date range/relative date/time of day, such as Last 7 days, this quarter, Custom range (e.g., Jan 1–Aug 31).
- Text Filter : To filter by text-based values such as Name , Description, Country, Product Name,Department, Sales Rep.
- Number : To filter data based on numeric ranges such as Sales > 10,000 , Quantity between 50 and 100 ,Profit < 0.
- Users need to click on the edit icon on the dashboard and then on the “Filter” icon present on the top right corner of the homepage and further select the type of filter according to the requirement.
-
Figure 8. Figure - Global Filter 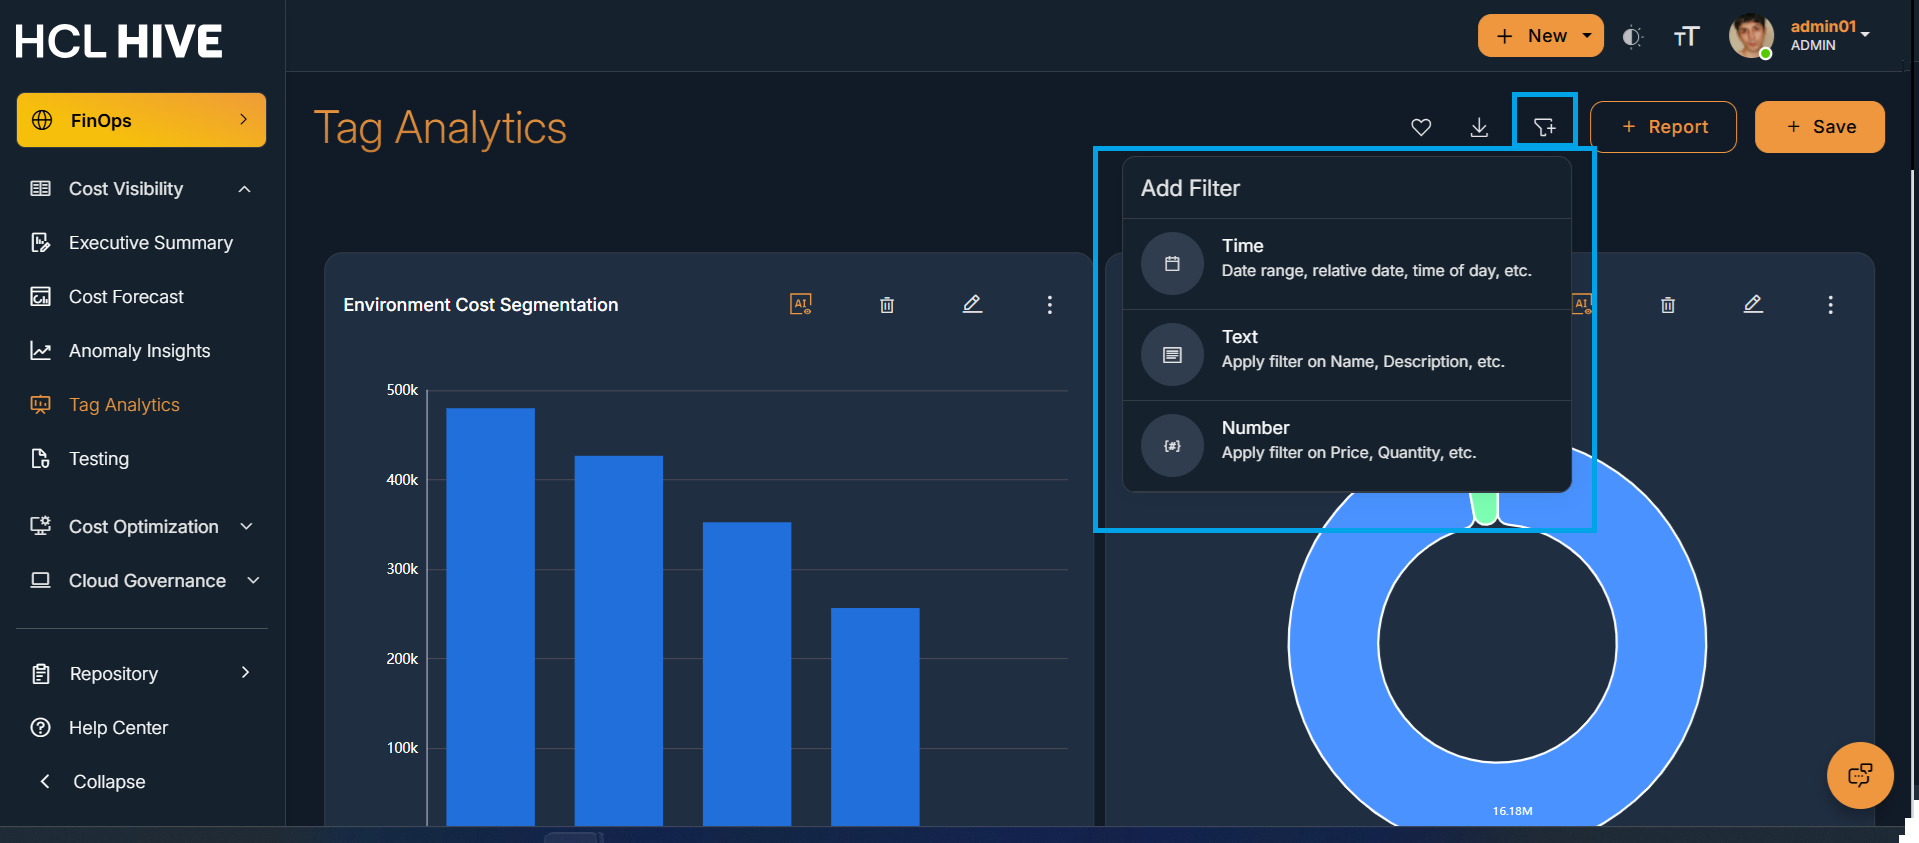
Figure 9. Figure - Time Filter 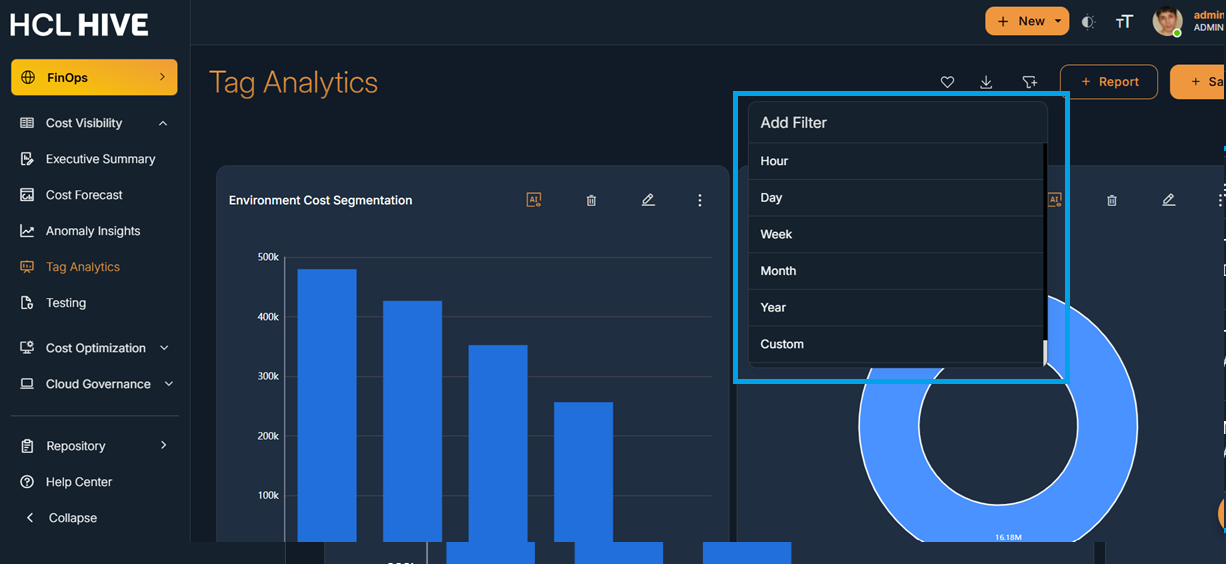
Figure 10. Figure - Text Filter 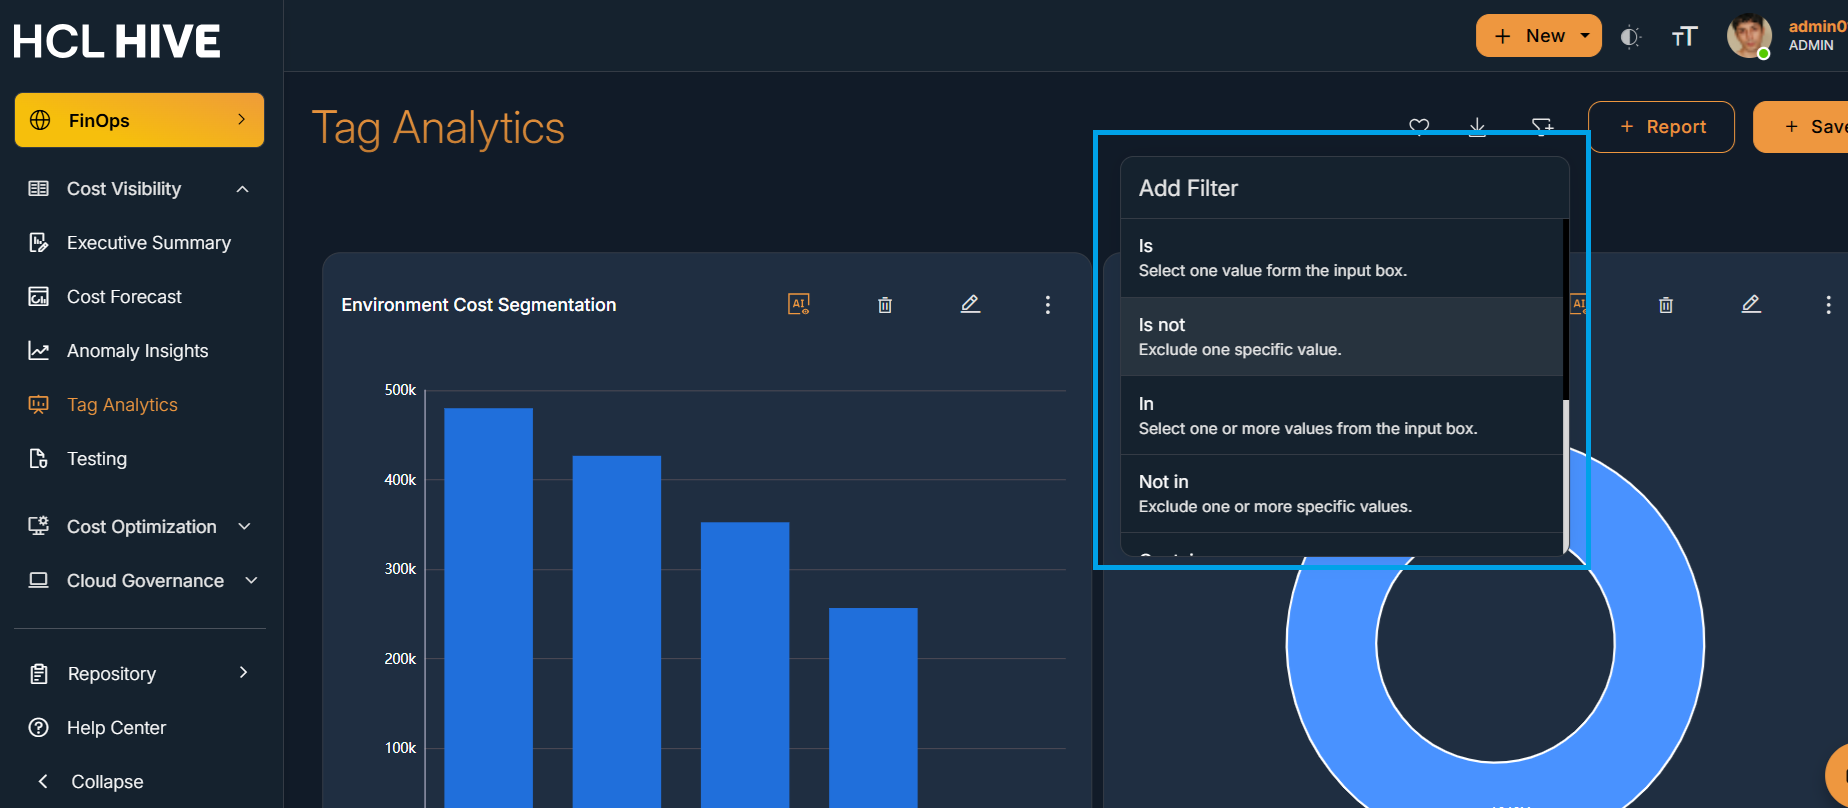
Figure 11. Figure - Number Filter